Permafrost Observatory at Barrow
Project Personel
Main Contact: Dr. Vladimir E. Romanovsky
Scientific Personel: V. E. Romanovsky, K. Yoshikawa (Water and Environmental Research Center, UAF, Alaska), J. Brown (International Permafrost Association), G. S. Tipenko
Collaborators:
Partner Organizations:
Project Summary

Changes in air temperature generally precede changes in permafrost temperature. However, because of the effects of the intervening snow cover, vegetation, and physical properties of soils within the layer above the permafrost where seasonal thawing-freezing occurs (an area called the active layer), somewhat different temperature changes are generated at the permafrost table. The common postulation that permafrost temperatures are a reasonably good indicator of climate change has thus been recently questioned. Our recent study shows that permafrost temperatures reflect changes in air temperatures over a long time scale (decadal and longer) much better than interannual air temperature variations.
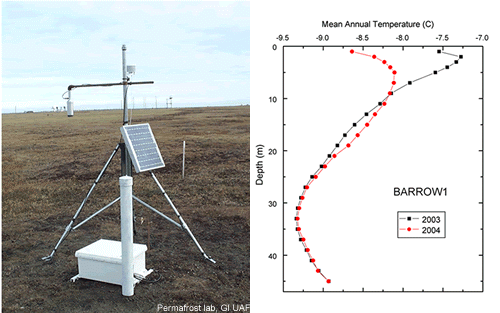
Long-term permafrost temperature records are needed to better understand the relationship between air and permafrost temperatures. This need is one of the reasons for re-activating sites where high quality permafrost temperature records were obtained decades ago. One such ideal place is Barrow, Alaska. During the past year a Permafrost Observatory was established at Barrow under the auspices of the International Arctic Research Center (IARC). The observatory was established to compare present permafrost temperatures with those obtained during the 1950s and early 1960s by Max Brewer. Those measurements were of very high quality, with a precision of generally 0.01° C.
 |
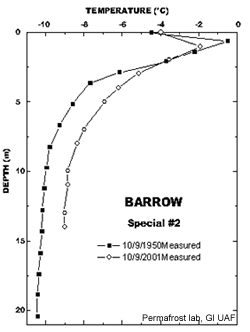
Comparison of permafrost temperature profiles obtained at the same location by Brewer on October 9, 1950 (personal communication) and by the UAF Geophysics research group on October 9, 2001 shows that at the 15-meter depth (which is slightly above the depth of annual temperature variations) the permafrost temperature is now warmer by more than 1°C This noticeable, but still moderate, increase over such a long period is consistent with our previous analysis of long-term permafrost temperature variations at Barrow for the period 1924 – 1997. That investigation was based on application of our high-resolution numerical model using the Barrow National Weather Service climate data and employing a "permafrost temperature reanalysis". In this modeling method, variations in the air temperature and snow cover thickness and properties are the driving forces of the permafrost temperature dynamics. The model is calibrated for a specific site using measured permafrost and active layer temperatures (usually several years of available data are used) and data from the closest meteorological station for the same time interval. The calibrated model can then be applied to the entire period of meteorological records at this station, producing a time series of permafrost temperature changes. The same calibrated model can be applied for predictions of the future permafrost dynamics when some future climate change scenario is used as input data.
 |
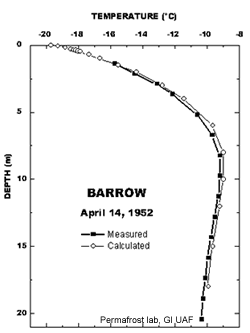
The historical permafrost data provide a unique opportunity to independently test our model and modeling results. This particular numerical model for the Barrow permafrost temperature regime was developed in 1997. The model was calibrated using data from shallow (down to one meter) soil temperatures obtained by Ken Hinkel at a Barrow site with surface conditions similar to the Brewer site. No data from the Brewer sites were used for the calibration. The daily air temperatures and snow cover thickness during the entire period of measurements (1924-2001) at the Barrow meteorological station were used as input data for this calibrated model. As a result, a time series of daily ground temperatures for the depths between 0 and 200 meters were obtained. To compare calculated temperatures with measured data, we used the time interval between September 1951 and October 1952, when weekly measurements were available. The results of this comparison were much better than expected. For the entire period, which covers more than one year, the differences between calculated and measured permafrost temperatures were typically smaller than 0.3°C in the depth interval between 2 and 18 meters. They practically never exceeded 1° C in the upper two meters of soil and permafrost. The picture on top shows a very good match between permafrost temperatures predicted using our model and the temperature profile measured by Brewer on April 14, 1952.
 |
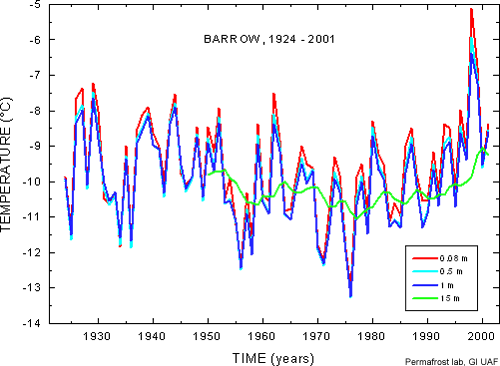
As an example, the picture shows that the thermal conditions near the permafrost table in Barrow, which is about 35 to 40 cm deep at this site, varied considerably during the entire period of analysis, with the temperatures being very similar during the 1940s and 1990s (except for unprecedented warm extremes of 1998 and 1999). The calculated permafrost temperature at 15 meters during the entire year of 1996 was very similar (within 0.1° C) to the permafrost temperature measured in 1953 at the same depth. It implies that the observed 1° C difference at 15 meters in permafrost temperatures between 1950 and 2001 is the result of very recent warming during the late 1990s. Much colder permafrost temperatures at the permafrost table (up to 2 to 3° C colder) were typical for Barrow during the 1970s.


