Modeling
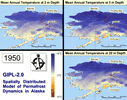
GIPL 2.0 - Spatially Distributed Model of Permafrost Dynamics in Alaska

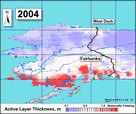
Given the possibility of climate warming in the near future, an evaluation of the magnitude of changes in the ground thermal regime becomes desirable for assessments of possible ecosystem responses and impacts on infrastructure in the Arctic and sub-Arctic regions. In the past, a soil model GIPL 1.0 developed at the Geophysical Institute Permafrost Lab was used to simulate the dynamics of the active layer thickness and mean annual ground temperature, both retrospectively and prognostically, using climate forcing from Global Climate Models. The GIPL 1.0 model is a quasi-transitional, spatially distributed, analytical model for the active layer thickness and mean annual ground temperature. This model is incorporated into GIS, which contains the information on geology, soils properties, vegetation, and snow distribution.
GIS allows visualization of input and output parameters and their representation in the form of digital maps. As a further significant step in the GIPL model development, we replaced the analytical solution with a numerical model based on a finite difference method for the non-linear Heat Conduction Equation.
In this model the process of soil freezing/thawing is occurring in accordance with the unfrozen water content curve, which is specific for each soil layer and for each geographical location. For each grid point on the map we used a one-dimensional multi-layer model of soil down to the depth of a constant geothermal heat flux (typically 500 to 1000 m). At the upper boundary, there are insulating layers of snow and vegetation that can change their properties with time. Special Enthalpy formulation of the energy conservation law makes it possible to use a coarse vertical resolution without loss of latent heat effects in phase transition zone even in case of fast temporally and spatially varying temperature fields. The new version of GIPL (GIPL 2.0) calculates soil temperature and liquid water content fields for the entire spatial domain with daily, monthly and yearly resolutions. The merge of the new GIPL and the GIS technique provides a unique opportunity to analyze spatial features of permafrost dynamics with high temporal resolution.
GIPL 2.1 - Spatially Distributed Model for High Performance Permafrost Dynamics
This version of the GIPL is physically identical to the version 2.0, but it has been updated and adjusted to run on a high performance computing platform. Message Passing Interphase or MPI was used to update this version. High resolution simulation of an entire landscape becomes possible in a shorter amount of time. There is no limit to assigning the number of processors because there is no communication between node points necessary to simulate the temperature in the permafrost as long as the nodes are not under each others influence. At which time it would become critical to simulate the problem in two or three dimensions.


