Synthesis and Integration of Environmental Data Along the East Siberian Transect and Comparison of Active Layer and Permafrost Conditions with an Alaskan Transect.
Project Personel
Main Contact: William Cable
Scientific Personel: V. E. Romanovsky, T. E. Osterkamp, T. S. Sazonova, G. S. Tipenko, D. O. Sergueev (UAF) as well as N. I. Shender, V. G. Rusakov, V. T. Balobaev (Yakutsk Permafrost Institute).
Collaborators:
Partner Organizations:
Project Summary
 |
At the present time, due to development of General Circulation Models and growing needs of understanding the impact of global climate change on the ecosystems, it becomes necessary to assess permafrost conditions for the circumpolar region in order to include them into GCM's. Collecting all necessary data for the entire circumpolar region in order to evaluate permafrost dynamics can be a very difficult task.
For our studies we choose two transects - Alaskan North Slope transect, which includes the area of the Kuparuk and Sagavanirktok River basins, and the Tiksi-Yakutsk East Siberian transect, designated as the Far East Siberian transect in the IGBP Northern Eurasia Study project (IGBP-NES).
There are three objectives in this analysis:
- Creating a database using GIS for the East Siberian transect which will include the most important environmental characteristics and data from the intensive permafrost study sites;
- Reconstruct the past (last century), hindcasts and forecasts of the 50 to 100 years active layer and permafrost dynamics for key sites along the East Siberian Transect and scale up this information for the entire transect area;
- Comparing present (measured), past and future (calculated) characteristics of the active layer and permafrost dynamics along the East Siberian Transect with those from the Alaskan Transect.
Main features of East Siberian transect
Click on each map to see full size image (50 - 180 kb)
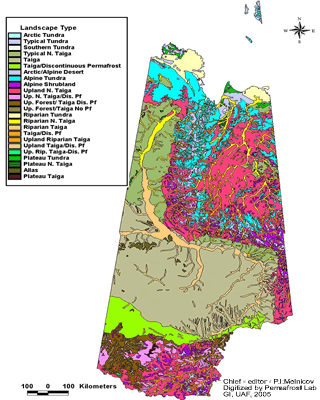 |
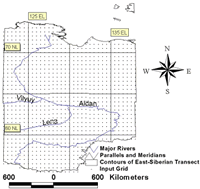
This transect was established in 1998 as part of IGBP Northern Eurasia Study project. East-Siberian transect centered on the 135° meridian and is a collaborative effort of IGBP-NES with the GAME project of the WCRP. The transect is centered on the 135° meridian and expanded from 70 degrees of Northern Latitude (N.L.) to 60 degrees of N.L. and spans the entire zone of continuous permafrost in East Siberia
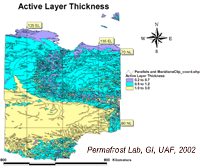 |
Active layer thickness and mean annual ground temperatures along with the thickness of perennially frozen earth material are the major characteristics of permafrost. Within the East-Siberian transect active layer thickness varies from 0.2 m, in the most northern parts of the transect and in mountainous areas, to up to 3 m in central and southern-western parts of the transect.
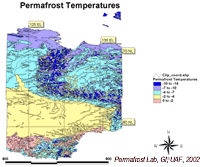 |
Permafrost temperatures or mean annual ground temperatures, usually measured at the depth of 10 – 15m, can be as low as –10 to –14°C in the north and in uplands and can reach 0 to –2°C in the most southern parts of the transect.
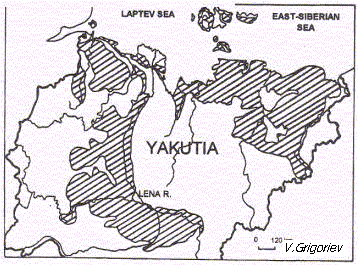 |
East-Siberian Transect spans the entire territory of Sakha republic. One can find great variability of landscapes within the transect. About one third of the transect is within the mountainous areas. Permafrost conditions vary a lot too - from thick permafrost (up to 1.5 km) in central and northern parts of the transect to 20 – 30 m thick in southern parts. |
|
Ice complex - or "yedoma" is the most interesting and intriguing feature of the transect. About 30% of the territory of the transect is underlain by these peculiar sediments, which can contain up to 80 percent of ice and the thickness of sediments can reach up to 100 m. However, there are several features which make the East Siberia transect an unique area. This region has the most extremely continental climate of any circumpolar area, most of the area is covered by large stands of deciduous larch forests, and the transition zone between tundra and boreal forest is gradual. | 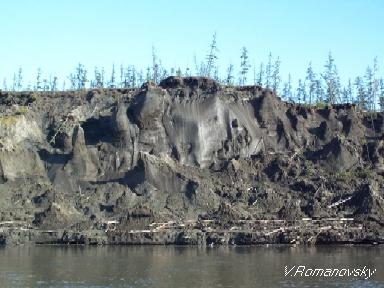 |
East Siberian transect
 |
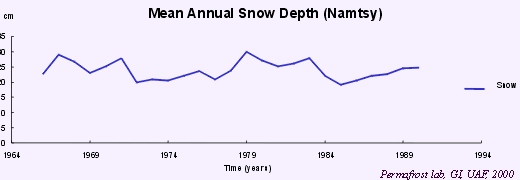
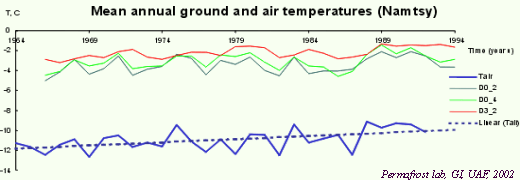
For evaluating the tendency of changes in air and ground temperature for the last 30 years on the territory of East-Siberian transect, the data from 52 stations was processed and analyzed. The data is the courtesy of the Permafrost Institute in Yakutsk. East-Siberian transect was established in 1998 as a part of IGBP Northern Eurasia Study project. It spans the entire zone of continuous permafrost in East Siberia. Only 29 meteostations are within the area of the transect. Most of the stations, within or outside the transect, have operated for more than 40 years (table1). Average mean annual temperatures vary within the transect area from less than -16°C in the Verkhoyansk region (data available since 1980) to -8°C near the southern limit of the transect. |
|
The data includes daily, monthly and mean annual values of air temperatures and precipitation, 10-day mean depths of snow cover, snow density and water equivalent, and the number of days with snow cover for each month. The duties of these stations also include measurements of the ground surface temperatures and snow surface temperatures during the winter. In addition to, each station has several shallow boreholes (0.1 to 3.2 meters deep) where yearly to daily temperature measurements were performed. High inertia mercury thermometers were used for measuring temperatures. Such thermometers give an error of + 0.1°C. Generally, the accuracy and quality of measurements varies depending on the year of collection, but the measurement technique and equipment have remained standard for the last 25 years. |
  |
A simple and accurate model for evaluating the permafrost dynamics was developed in Geophysical Institute Permafrost Lab (GIPL). The GIPL model is a fusion of the modified Kudryavtsev's approach, which is a set of analytical formulas for active layer thickness and mean annual ground temperature calculations, with a Geographic Information System (GIS). The GIS contains several layers, representing geology, vegetation, mean annual air temperatures, air temperatures amplitudes and mean annual snow thickness.
G
|
Input parameters: layers |
 |
Program that calculates Active Layer Thickness |
 |
|
|---|---|---|---|---|---|
|
Geology, soil properties (moisture) |
And Permafrost Temperatures (Fortran) |
Map of Active Layer Thickness Distribution |
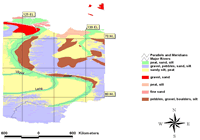
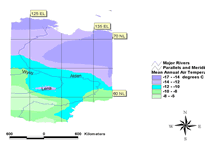
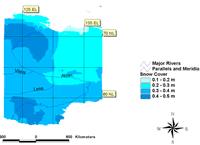
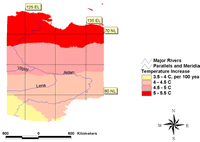
Input parameters of East Siberian Transect
 |
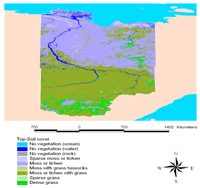 |
Input data for the grid of 0.5 to 0.5 degrees dimensions was provide by David McGuire's group. There are 1000 grid cells within the transect, For each grid cell - mean annual temperatures, air temperatures amplitudes and mean annual snow cover thickness for the period 1901 - 2100 are known.
The scenario of global warming has been used to obtain mean annual temperatures for the period of 2000 - 2100 years.
Click on each map to see full size image (20 - 70 kb)
|
|
|
|
Program block
The program for active layer thickness and mean annual permafrost temperatures calculations - "Kudr" - was written in Fortran and utilizes Kudryavtsev's formula. Kudryavtsev's formula is an analytic solution for heat conduction equation for a one dimensional case with periodical stable regime.
Upper boundary condition is in the form of a periodic function - representing the annual cyclic variations of air temperatures. The formula allows to obtain maximum thickness of active layer and mean annual temperature at the bottom of active layer.
The evaluation of the GIPL performance showed that when applied to long-term (decadal or longer time scale) averages, this model achieves an accuracy of + 0.2÷ -0.4ºC for the mean annual ground temperatures and + 0.1 ÷ - 0.3 m for the active layer thickness calculations.
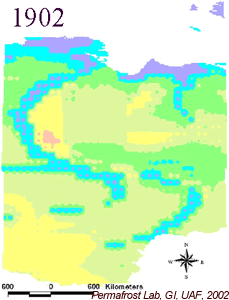
Output of East Siberian transect
 |
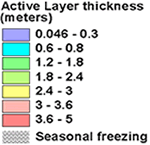
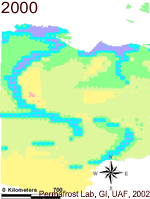
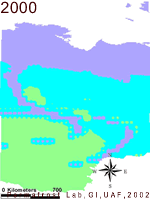
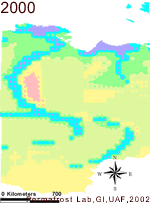
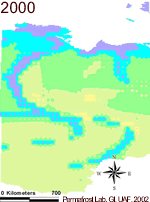
Scenarios of future climate changes - Maps of the active layer thickness
If the scenario of global warming, used in our studies is correct, then we might expect the considerable warming of ground temperatures (to 3 - 4 degrees C) and increase in active layer thickness (up to 1 - 1.5 m) within East-Siberian transect.
The increase in air temperatures will have the most pronounced effect on permafrost in southern parts of East-Siberian transect and even cause the taliks formation and permafrost degradation on, where only seasonal freezing takes place.
The increase in permafrost temperatures and in active layer thickness will not be uniform in time and there will be some years during which decrease in temperatures may occur.
Click on each map to see animation changes in the active layer thickness with 25 - 30 years time step (100 - 300 kb)
|
|
|
|
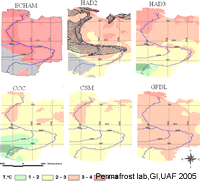
Five GCM (General Circulation Models) have been used in this research. These models were chosen for ACIA (Arctic Climate Impact Assessment) program. Two of them are GCM's of Hadley Climate Center: HadCM2 and HadCM3. Model HadCM2 based on historical data and was used as a reference for comparison with other models. Had CM2 scenario was chosen as a reference one because it is based on historical data and other values in points are obtained by interpolation between meteorological stations at which measurements have been taken.
The forecast for future (2000 - 2100 years) was obtained by using random numbers and choosing from historical data and then the trend of global warming has been applied.
The other models include GCM's from Canadian Climate Center (CCC), NCAR (CSM), and Geophysical Fluid Dynamics Laboratory (GFDL).
East Siberian Transect
 |
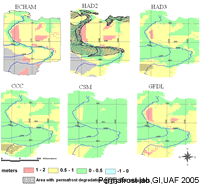 |
The comparison shows that the range of increase in five-years mean ground temperatures varies from 2 to 5 degrees C for different models for northern parts of the East Siberian transect and from 1 to 3 degrees C for southern parts. GFDL and HadCM3 models are the closest to the referenced scenario. Three models CCC, HadCM3 and the reference model predict the formation of the zone on which permafrost is thawing from the surface. Reference scenario predicts that the zone with thawing permafrost will occupy almost entire southern-western, upland part of the East Siberian transect. According to CCC and HadCM3 models that zone will be considerably smaller but at the same location.
Comparison of four GCM's scenarios with referenced one shows that the increase in active layer thickness will range from 1 to 2m in mountainous and upland areas with coarse sediments and from 0.5 to 1m in valleys and lowlands. The maximum increase in active layer thickness will take place in central parts with coarse sediments of glacial origin.
GFDL and HadCM3 models are the closest to the reference model. When considering the future of the "ice complex" and taking into account that the thickness of the protection layer is 1.8 - 2.5 meters, it is possible to point out a zone within which increase in active layer thickness will exceed 1.5 m. This zone is narrow and located on the eastern bank of Lena River. "Ice complex" are syncryogenic soils with huge ice wedges in silt matrix, volumetric ice content can reach 80%, the thickness of those sediments can be up to 100 m.
If active layer reaches the ice horizon, the consequences can be quite severe. Ice melting will lead to subsidence of the ground and water pools formation. Water pools in summer time will increase heat influx into the ground and will cause ice to melt further and faster.
Alaskan Transect
 |
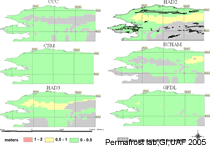 |
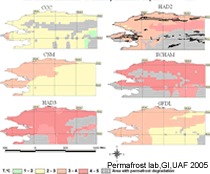
The permafrost degradation from the surface will start as early as 2025 and will progress to 2099 according to the CCC, GFDL, HADCM2, HADCM3, and ECHAM models. The spatial dynamics of the permafrost degradation will not be uniform in time. There will be cold and warm time periods on the background of the trend of the mean annual air temperature warming. HADCM2, HADCM3 and GFDL predict that the area with the permafrost degradation will be in the south-eastern part of the Alaskan transect. The area will be within the Brooks Range and in the Interior according to CCC and ECHAM. The relative increase in mean annual ground temperatures will be from 1 to 6 ºC by the end of 21 st century. The active layer thickness will be up to 0.5 m deeper by the year 2099.
The analysis of GCMs showed that CSM, ECHAM and GFDL are the closest to the reference HADCM2 GCM in terms of mean annual air temperatures.
The permafrost degradation from the surface will start as early as 2025 and will progress to 2099 according to the CCC, GFDL, HADCM2, HADCM3, and ECHAM models. The dynamics of the area with permafrost degradation will not be uniform. There will be cold and warm time periods on the background of the trend of the mean annual air temperatures warming. HADCM2 and GFDL predict that the area with the permafrost degradation will be in the south-eastern part of the Alaskan transect. This area will be within the Brooks Range and the Interior according to CCC, ECHAM, and HADCM3.
According to the GCMs the relative increase in mean annual ground temperatures will be from 2 to 6 ºC by the end of 21st century. This increase will cause a deepening of the active layer thickness by up to 0.5 m.
The Area with Permafrost Degradation
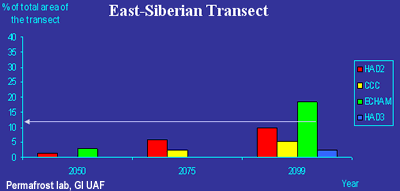
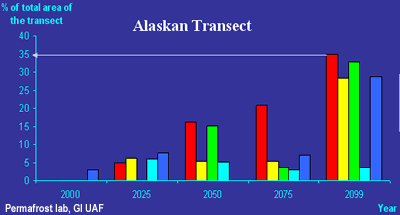
In the 21 st century the active layer thickness will deepen by 0.5 - 2 m everywhere within the East-Siberian transect, and that mean annual ground temperatures will rise by 2 - 6ºC according to all GCMs except CSM. However, the increase in mean annual ground temperatures and the active layer thickness will not be uniform in time. There will be relatively cold and warm periods caused by natural variations of air temperatures. These variations will be superimposed on the background warming trend. In the Alaskan transect, the relative increase in mean annual ground temperatures will be from 2 to 6 ºC by the end of 21 st century. This increase will cause the deepening of the active layer thickness up to 0.5 m.
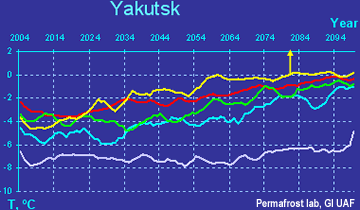
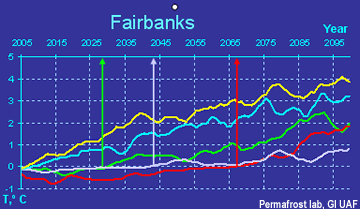
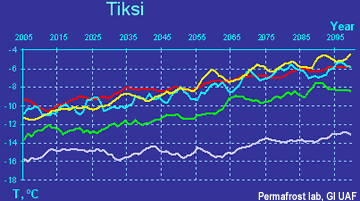
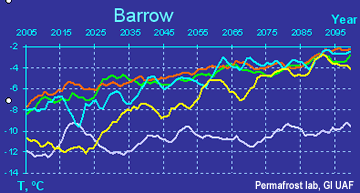
Mean annual ground temperatures at 1 m Depth (Five-years running average)
The numerical modeling of ground temperatures at 4 sites (2 in Alaska and 2 in East-Siberia) for the 21st century shows that decadal fluctuations with the periods ranging from 10 to 20 years took place in both regions. The magnitudes of these fluctuations did not exceed 1 to 2ºC. The fluctuations of mean annual ground temperatures were synchronized in Fairbanks and Yakutsk, and in Barrow and Tiksi. The magnitude and timing are slightly different for each of the sites.
