Establishing a Distributed Permafrost Observatory Network in Western Alaska
Project Personel
Main Contact: Dr. Vladimir E. Romanovsky
Scientific Personel: Vladimir Romanovsky, William Cable
Collaborators:
Partner Organizations: Selawik National Wildlife Refuge (Lee Anne Ayres and Anne Orlando)
Project Summary
The area of Western Alaska including the Selawik National Wildlife Refuge (SNWR) is generally underrepresented in terms of permafrost thermal monitoring. Thus, the main objective of this study was to establish a permafrost monitoring network in Western Alaska in order to understand the variability in permafrost thermal regime in the area and to have a baseline in order to detect future change. Over the summers of 2011 and 2012 a total of 26 automated monitoring stations were established to collect temperature data from the active layer and permafrost. While most of these stations were basic and only measured the temperature down to 150 cm at 4 depths, three of the stations had higher vertical temperature resolution down to 3 m. The sites were selected based upon an ecotype map that had been created for the area in 2009 with the idea that ecotypes (basic vegetation groups) might be good indicators of the permafrost thermal state within an area experiencing similar climatic drivers. We found the Upland Dwarf Birch-Tussock Shrub ecotype to be the coldest with an average mean annual ground temperature at 1 meter (MAGT1.0) of -3.9 °C during the August 1st, 2012 to July 31st, 2013 measurement period. This ecotype is also the most abundant in the SNWR, covering approximately 28.4% by area. The next most abundant ecotype in the SNWR is the Lowland and Upland Birch-Ericaceous Low Shrub with an area coverage of approximately 10.5%. This ecotype had warmer permafrost than the Upland Dwarf Birch-Tussock Shrub ecotype with an average MAGT1.0 of -2.4 °C during the same measurement period. We also found that within some ecotypes (White Spruce and Alder-Willow Shrub) the presence or absence of moss on the surface had a strong association with the permafrost thermal regime. In fact the absence of moss in both these ecotypes seems to indicate the absence of near surface permafrost. In general, we found good agreement between ecotype classes and permafrost characteristics such as mean annual temperature, active layer thickness, and freeze back duration. Thus, we believe it might be possible to translate the ecotype map into a permafrost map using our measurements. Such a map would be useful in decision making with respect to land use and understanding how the landscape might change under future climate scenarios.
To establish a network of permafrost observatories of different complexity within the Western Alaska LCC region, at the boundary between continuous and discontinuous permafrost. Collection of active layer and permafrost temperature records will be used to produce a reliable high-resolution model of the present thermal state of permafrost and potentially its past and future changes within western Alaska.
Project Site Map
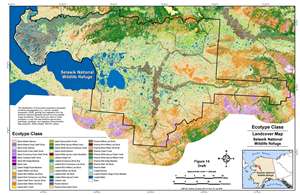
In the summer 2011 10 spatially distributed sites (see below for description) were installed in locations where Anne Orlando would also be measuring snow depth for her caribou study. These sites have a wider distribution than just the Selawik NWR. Later in the Fall of 2011 sites for 2012 were selected based on integrative analysis of the existing data on generalized ecotype classes, soil landscapes, and vegetation type distribution. These data are available from the publication “An Ecological Land Survey and Landcover Map of the Selawik National Wildlife Refuge” prepared by ABR, Inc. Environmental Research & Services, Fairbanks, AK and by US FWS, Anchorage, AK (Jorgenson et al, 2009). All maps from this publication are available in GIS format. This publication and an additional database compiled as a result of this project include a detailed description of many investigation sites visited during 2007-2008 as a part of the project. A wealth of information about these sites is also available from the organizations that conducted this research. This information as well as the logistics approach used guided us in determining locations for the distributed permafrost observation sites.
In the summer of 2012 an additional 13 spatially distributed sites and 3 core measurements sites with more intensive measurements were installed. Data from the core measurement sites is collected remotely with cellular modems or Iridium transceivers and can be accessed through each sites page (Selawik Village, Kugurak Cabin, and Selawik Thaw Slump). All the sites associated with this project can be seen and accessed below. Also, during the summer of 2012 data was collected from many of the sites that were installed in 2011.
In early August, 2013, all established sites were visited and data were collected from the data loggers. Several of 2011 sites were decommissioned because of the damage to these sites by wildlife.
In late July, 2014 all sites were again visited for data collection. During these site visits a small soil pit was dug at each site in order to characterize the general soil layers and for comparison with the soil information collected by Jorgenson et al. (2009). Unfortunately a few sites were damaged by wildlife but all sites were repaired.
Data from these sites, the sites with near real-time data, and photos and information for all sites can be accessed from each site’s webpage accessible below via the interactive map.
Our measurement design consists of a two-tiered site layout. The first tier, core sites, (Figure 2) are collecting high temporal and vertical resolution temperature data. These sites consist of a CR1000 data logger (Campbell Scientific, Logan, UT) that collects and saves data from the attached logger sensors measuring air temperature, snow depth, a high vertical resolution thermistor probe with 16 thermistors spaced exponentially to 1.5 m depth, and three deeper soil temperature sensors (2.0, 2.5 and 3.0 m in most cases). The temperatures are measured every 5 minutes and hourly averages are stored on the data logger. The core sites are also equipped for remote communications using Iridium satellite transceivers or cellular modems (Selawik Village). We are currently collecting the data from the sites remotely on a weekly or daily basis.
The second tier of spatially distributed sites are deployed to capture the spatial variability in active layer and permafrost temperatures in the region. These sites consist of a U-12 data logger (Onset, Cape Cod, Massachusetts) and four soil temperature sensors located within the active layer and upper permafrost (3, 50, 100, and 150 cm depth in most cases). These data loggers record an instantaneous temperature every 4 hours. Data from these sites has been collected manually once per year.
Permafrost Map
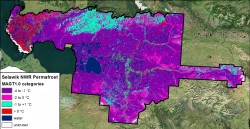
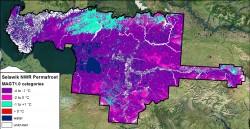
As a proof of concept we used the range of MAGT1.0 measured across these different ecotypes to reclassify the ecotype map from Jorgenson et al. (2009) into classes of permafrost temperature. First, for ecotypes from which we had measurements, we classified the range of MAGT1.0 into one of 4 categories: -4 to -1 °C, -2 to 0 °C, -1 to +1 °C, and greater than 0 °C. These ranges were chosen to accommodate the majority of mean annual temperature ranges for each ecotype observed during our measuring period. Then, for ecotypes where we didn’t have any measurements we used the vegetation and soil descriptions in Jorgenson et al. (2009) and consulted with Torre Jorgenson to decide how they should be classified. Additionally, we added an unknown category for ecotypes where we were not comfortable placing them into a category due to lack of information. Finally, we created two versions of the MAGT1.0 map for Selawik NWR, one with all the ecotypes and one where the ecotypes we did not make any measurements in are masked out.
Please see the complete report, attached as a pdf at the end of this page.
Data from this project is available via each sites individual webpage, linked through the map above. The site pages also have photos of the sites an plots of the daily average subsurface temperature data for each year. Additionally, the data is hosted on the ACADIS gateway, as a complete dataset.
| Attachment | Size |
|---|---|
| 10.39 MB | |
| 18.31 MB |


